Waste electrical and electronic equipment processed in 2025 – the trend continues
The amount of waste electrical and electronic equipment processed is 6 per cent more compared to the previous year and exceeds the 140,000-tonne mark for the first time. Almost all categories of equipment saw an increase. The trend of recent years thus continues. Base metals continue to account for the majority of the fractions produced, followed by plastics and mixed fractions, while the segregation of particularly valuable and hazardous components has been further optimised.
Material flow survey 2025
The newly developed WEEE flow software was used for the second time for the 2025 material flow survey. Based on the experience gained from the first survey the previous year, a number of minor adjustments have been made and the analysis options further optimised. Minor adjustments were also made in the area of recording processes to improve data quality still further. As at the end of February, the material flows from 23 operating sites were recorded and subsequently reviewed by the responsible parties of the technical commissions of Swico Recycling and SENS eRecycling. This involves reconciling the flows between the sites and collecting various key figures for plausibility checks. Any discrepancies detected are shared with the recycling partners and remedied as necessary. This ensures a robust data foundation despite the high level of complexity (over 100 different fractions).
Equipment processed
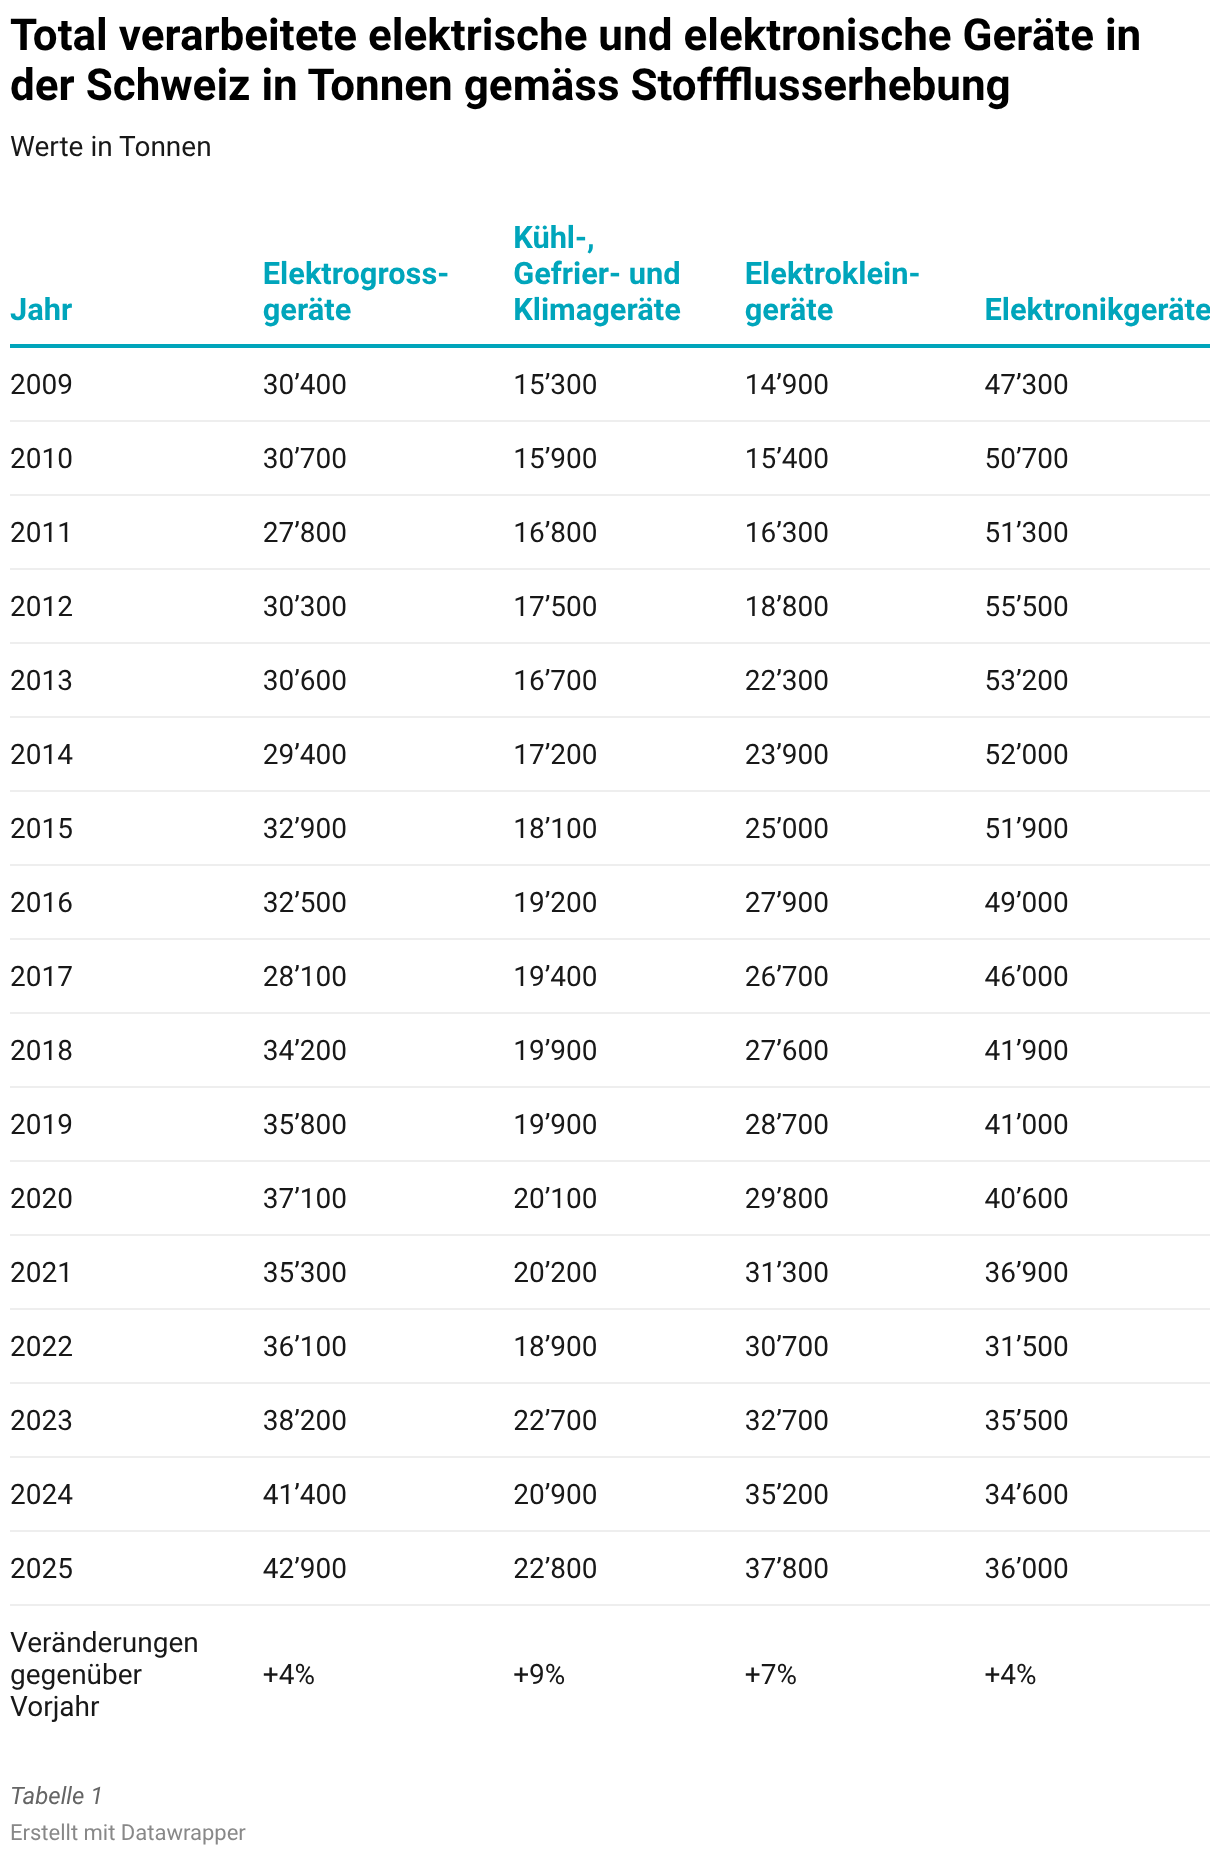
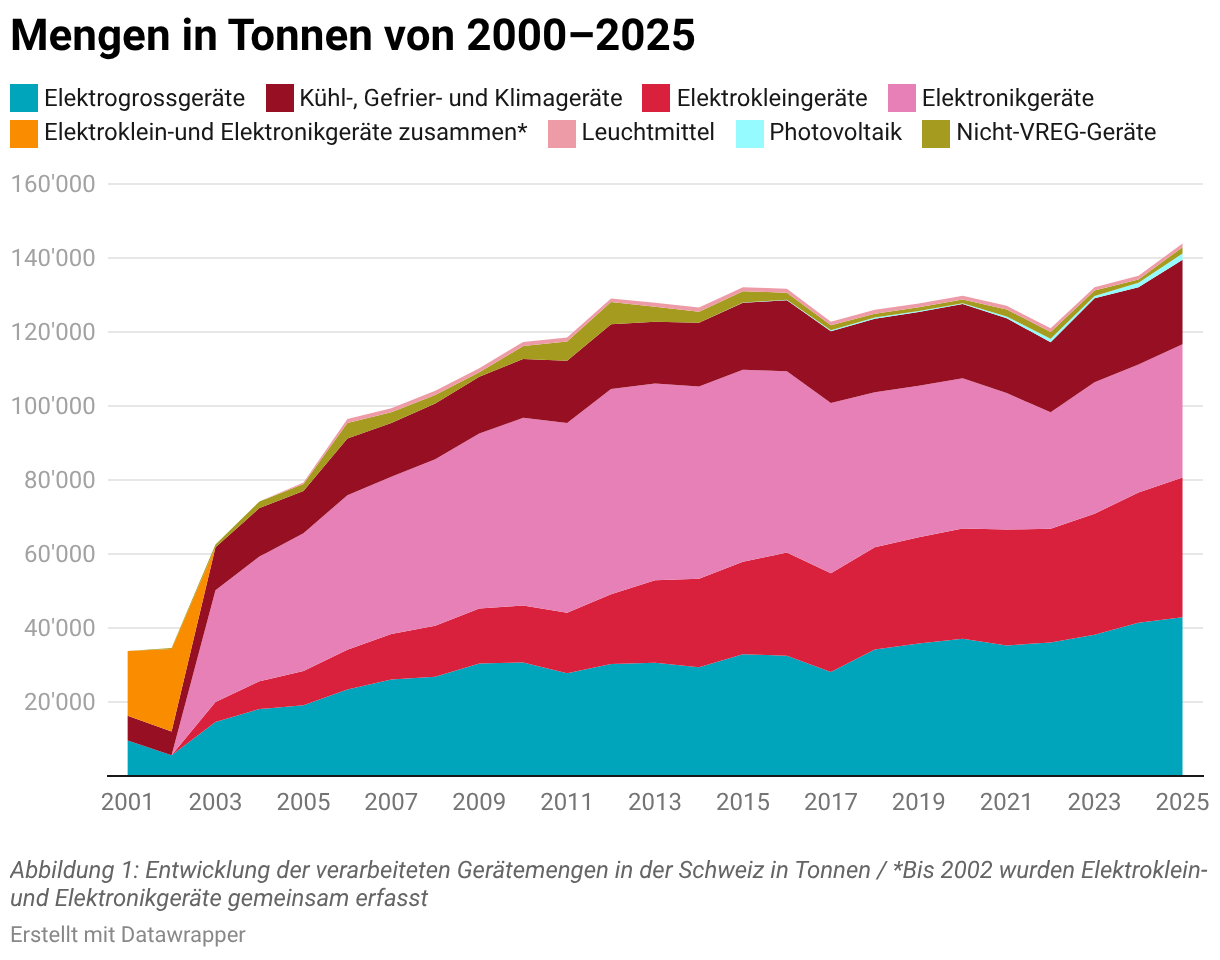
In 2025, the Swico and SENS recycling companies processed around 144,000 tonnes of waste electrical and electronic equipment (WEEE). This is an increase of 6 per cent compared with the previous year’s figure. Within each category of appliances, the trends seen in recent years have continued. Since data collection began, a steady increase has been observed in the number of large electrical appliances, small electrical devices, and refrigeration, freezer and air-conditioning units. The sharp decline in the volume of electronic devices (caused in particular by the significant drop in sales of heavy cathode-ray tube sets; see the “Trends” section) came to a halt in 2022. The trend has since been towards a slight increase again. The volume of lighting equipment processed has remained constant for years, while the number of photovoltaic modules processed has increased rapidly since 2020.
Fractions generated
The WEEE items taken back are processed by Swico and SENS recycling partners through manual and mechanical processes. This results, on the one hand, in “final” fractions that can be sent directly for material recovery (e.g. pure metal fractions). In other fractions, recyclable materials are concentrated; however, the processing into final fractions is carried out by specialist recycling companies outside the Swico/SENS system (e.g. plastics-metal mixtures or mixed plastics). The process also produces waste fractions that are not suitable for material recovery and are therefore incinerated. Fractions containing pollutants, such as capacitors, or residues containing mercury are subjected to individual special treatments and disposal processes.
The annual material flow survey records the inflows and outflows of materials, as well as the stock levels of WEEE items and the resulting fractions, at Swico and SENS recycling partners. Details on further processing, the materials finally recovered, as well as the recycling and recovery rates are collected per treatment stream in batch tests.
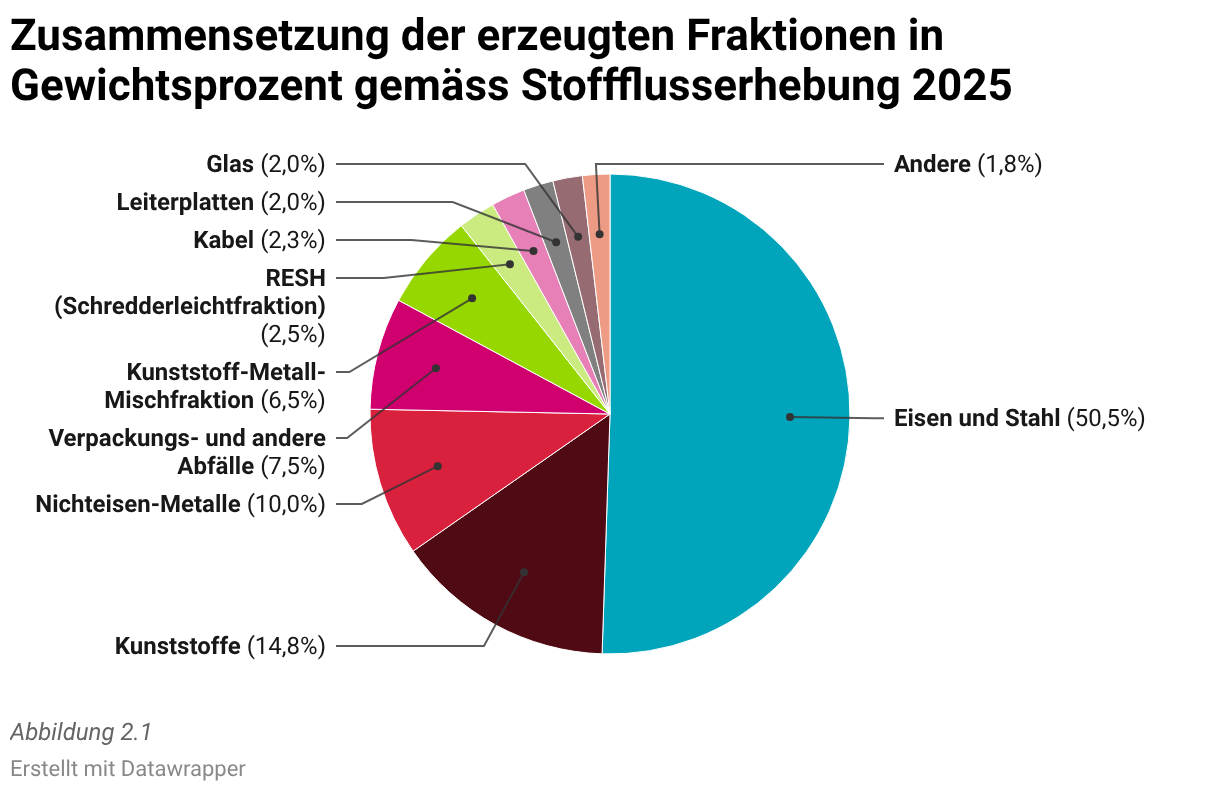
Figure 1 shows the fractions generated by Swico and SENS recycling partners in 2025 from the processed volume of WEEE items and forwarded for final recovery, further material processing, incineration or disposal. Metals account for around 60 per cent of the total and are largely recycled directly at appropriate smelting plants. Plastics (15 per cent) are increasingly being sent for recycling (see “Findings from SwicoMix Batch Experiments”). Plastics that cannot be recycled due to their low quality or pollutant content are incinerated together with a large portion of packaging and other waste1 (7.5 per cent) as well as shredder light fractions (2.5 per cent). Glass (2 per cent) is sent for recycling wherever possible; copper is recovered from cables (2.3 per cent) in particular, while printed circuit boards (2 per cent) are processed by multi-metal smelters to recycle copper, precious metals and other metals (see: “Final processing of fractions containing precious metals”). The mineral and other recyclable materials2 are further processed with the aim of maximum material recycling, while the fractions containing pollutants are treated and disposed of in special processes. Although the latter account for a small proportion by mass (<0.5 per cent), the removal and proper disposal of these components and substances make a significant contribution to the environmental performance of the Swico/SENS recycling system.
Trends
The trends in the mass fractions of the fractions generated is influenced by a number of factors. The mix of appliances varies from year to year (see section “Equipment processed”). In addition, there are developments in the material composition (e.g. metal housings are increasingly being replaced by plastic housing) but also developments in the process technology. As a result, the composition of the fractions varies from year to year.
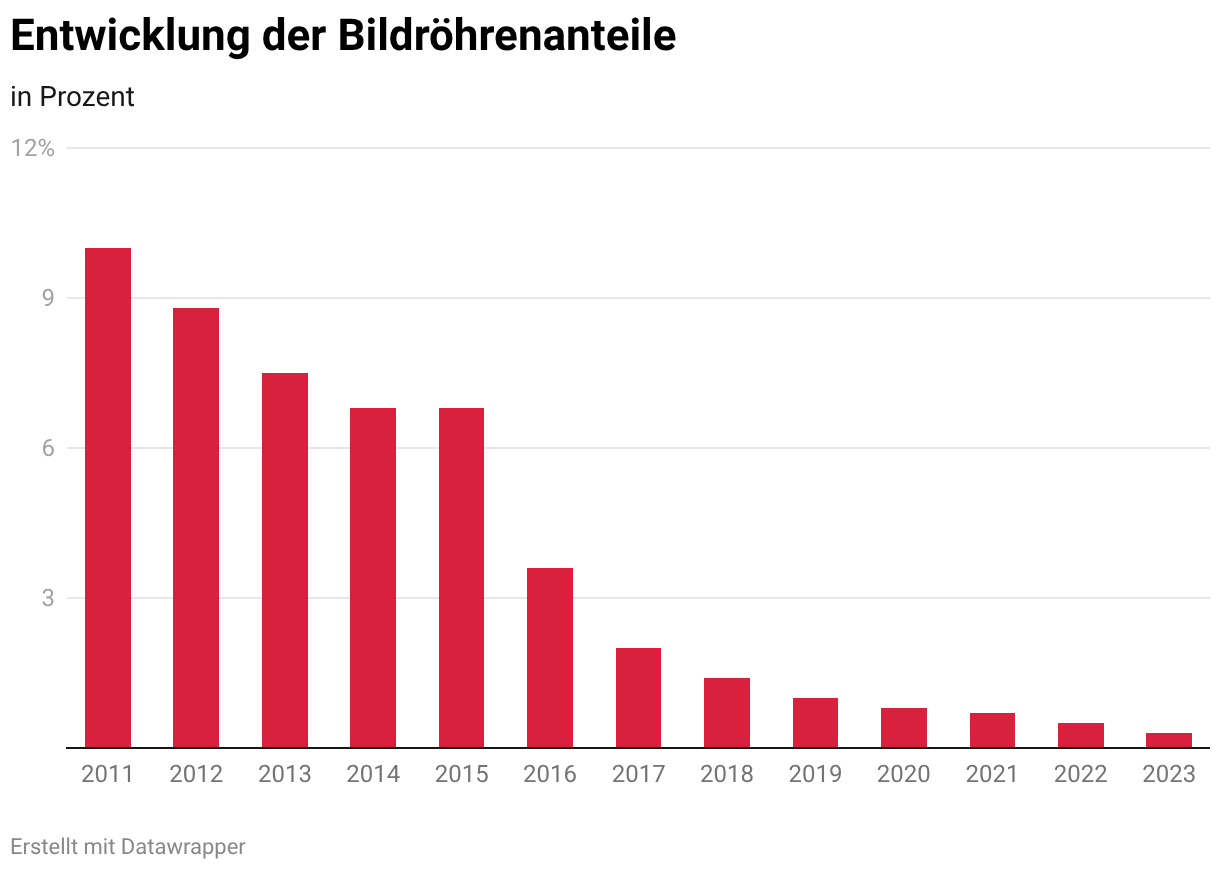
The decline in cathode ray tubes is particularly significant in this context. In 2011, the proportion was still 10 per cent, but it has fallen sharply in the years since. The figure has been below 1 per cent since 2020 and continues to fall (see Figure 2.1). From 2024, cathode ray tubes are therefore classified as “other recyclable materials” in the technical report.
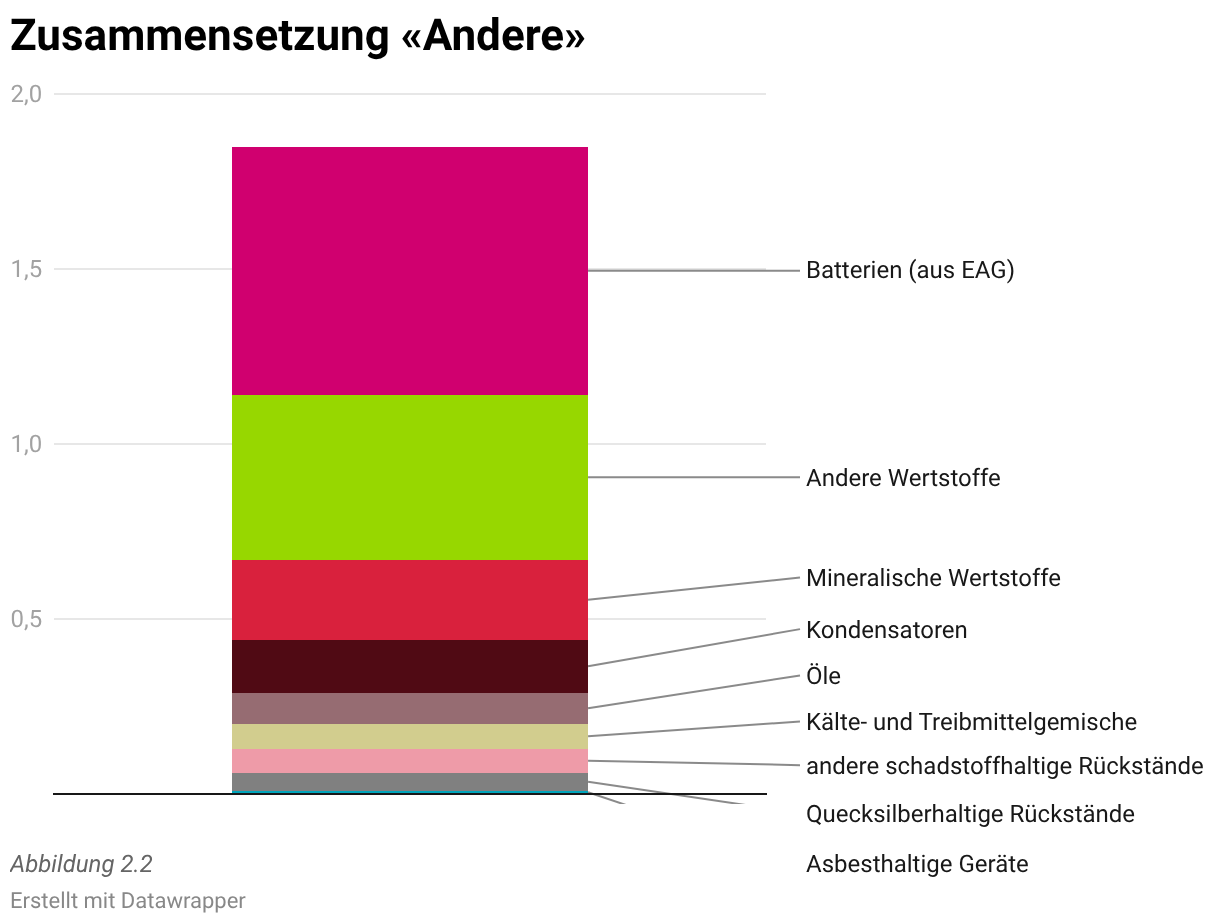
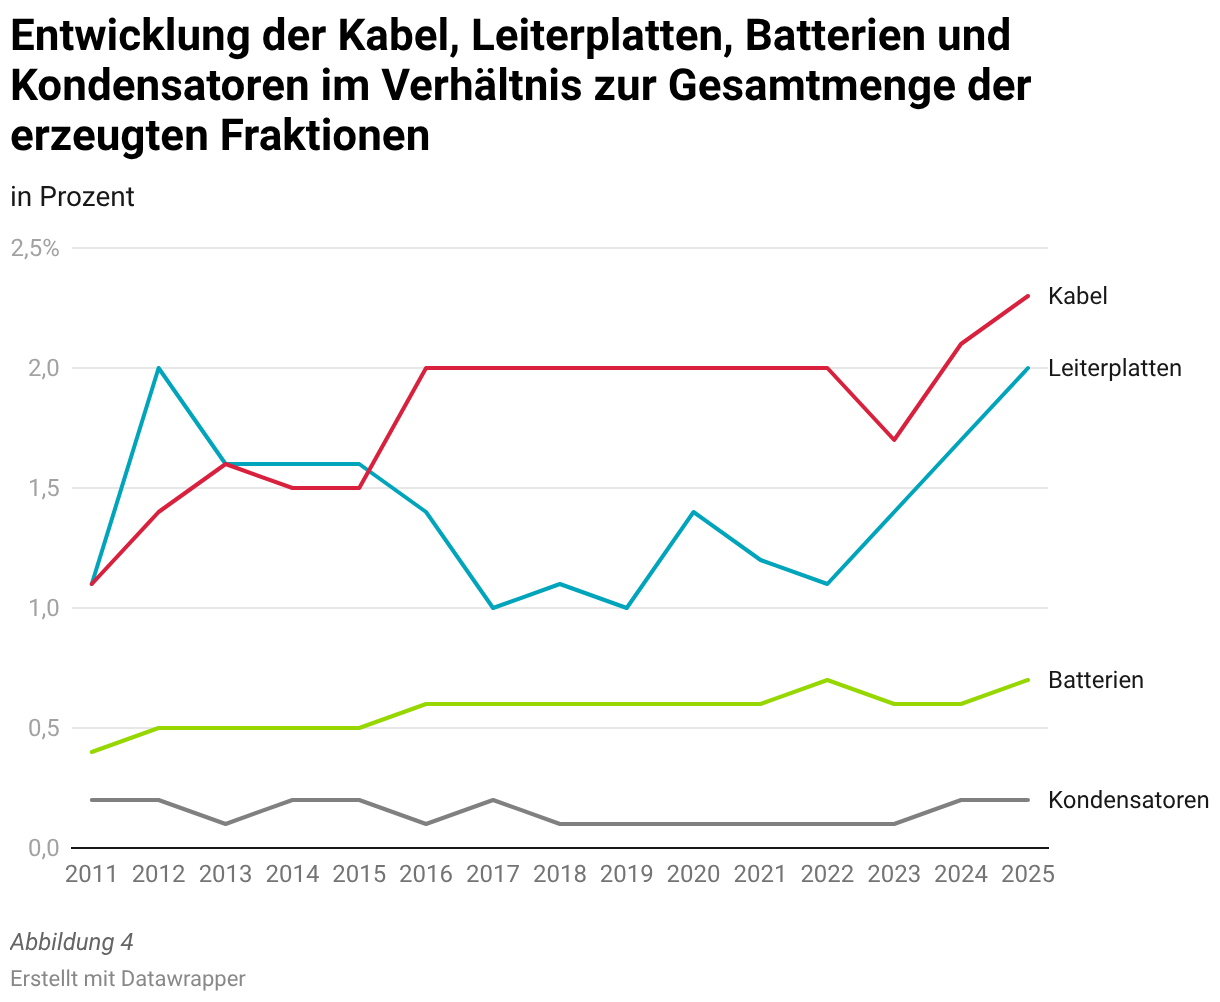
Figure 2.2 also shows the trend in the mass fractions of batteries, capacitors, printed circuit boards and cables. These components are largely removed manually. Any remaining residue is additionally removed after mechanical shredding. The proportion taken up by batteries is continuously increasing, which poses a great challenge for both the transport and the treatment of WEEE items. The proportion of capacitors has remained the same over the years, which suggests that the quality of the removal process has remained consistent. The increase in cables and circuit boards is also notable in a positive way, as copper and precious metals can be recovered through the targeted separation of these fractions. This has not only a financial but especially also an ecologically relevant benefit (see article “Life Cycle Assessment”).
Take-back and composition of electronic appliances
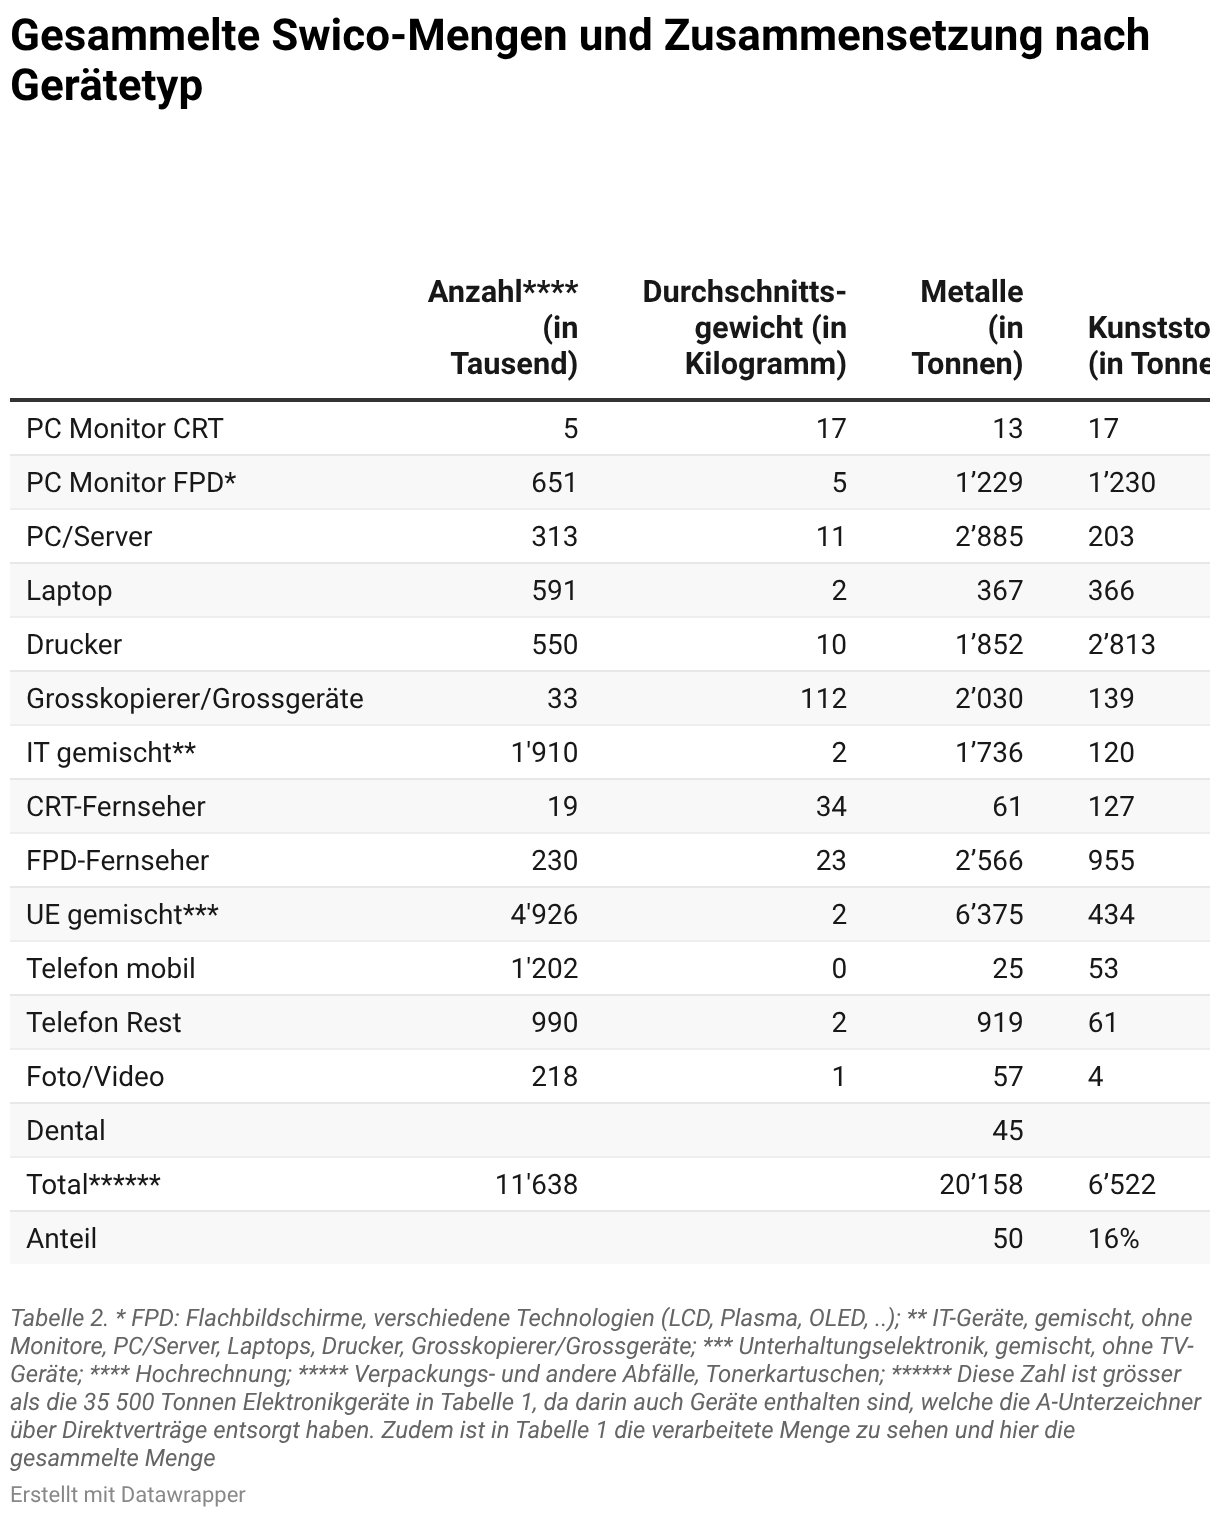
Swico Recycling regularly assesses the take-back volumes and the composition of electronic appliances. Swico records the total number of appliances taken back in the office/IT, consumer electronics, communications and photography/video sectors. Statistical surveys (using what is known as the “shopping basket analysis”) provide additional data on the subcategories listed, as well as on trends in average weights. In addition, the material composition of the individual categories is analysed in detail in specific processing trials.
In 2025, Swico Recycling collected 40,200 tonnes3 of electronic equipment, which is 2 per cent more than in the previous year. Significant declines in volume can be observed in particular for monitors and large-format copiers, which are offset by even greater increases in volume in the categories of laptops, printers and flat-screen televisions.
The number of appliances taken back (extrapolated based on average weights and volumes within each product group) increased by 8 per cent over the same period and amounted to 11.6 million appliances in 2025. In particular, growth in the categories of laptops, miscellaneous IT, miscellaneous consumer electronics and telephones (mobiles and others) has been significant.
The detailed volumes of electronic appliances taken back and their composition are shown in table 2.